Here are the python scripts anyone can use to recreate the plots used throughout. Formal paper with math at bottom.
These scripts have variables for different aspects. Gap size, number of prime waves, selections of primes, skipping set amounts, opacity; are all important depending on the size and selection of primes you choose. I recommend starting with the code pasted here and tweak the variables from there. Make sure you have the libraries installed at the top of the script or they won’t work.
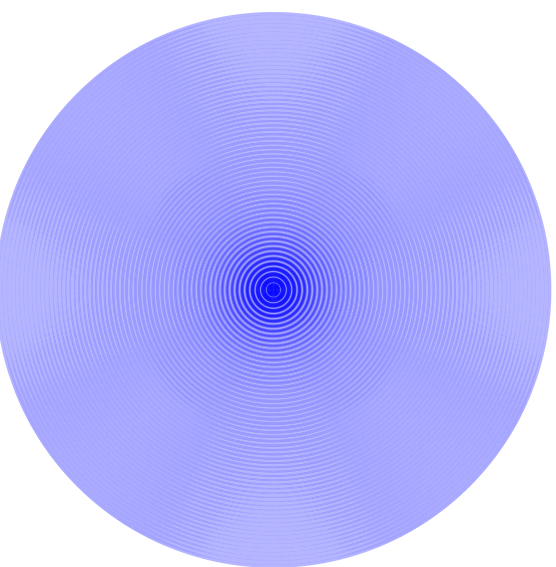
Below is the main 2d wave field I have showed, primes as frequencies, self bound as loops. These 4 scripts are the main plots used, so I gave 4 examples, same scripts, but with different variable settings to give you starting points. As discussed, you must change gaps, opacity, amount of prime waves used, amplitudes, line width, skips, etc… to get to different layers of patterns. If you don’t see much, try zooming in.
Click on the box to expand for the code.
2D circular wave field v1 – large waves
# prime_wavefield_demo.py (excerpt)
import numpy as np
def gaps_to_freqs(primes):
gaps = np.diff(primes)
return 1.0 / gaps
def prime_wave_field(primes, phases=None):
freqs = gaps_to_freqs(primes)
if phases is None:
phases = np.zeros_like(freqs)
# toy superposition (1D)
x = np.linspace(0, 1, 2000)
field = sum(np.cos(2*np.pi*f*x + p) for f, p in zip(freqs, phases))
return x, field
# ... (full script here)
# 3-D “stacked rings” of prime modes with flexible PRIME SELECTION.
import numpy as np
import matplotlib.pyplot as plt
from matplotlib import cm
from mpl_toolkits.mplot3d.art3d import Line3DCollection
import matplotlib.colors as mcolors
import matplotlib.cm as cm
# ───────────────── CONFIG ─────────────────
# ----- How to choose which primes to plot -----
PRIMES_MODE = "index_range" # one of: "first_n" | "index_range" | "value_range" | "explicit"
FIRST_N = 1 # used if PRIMES_MODE == "first_n"
INDEX_RANGE = (2,50000) # inclusive ordinals (1-indexed): (start_k, end_k), used if "index_range"
VALUE_RANGE = (2, 3) # inclusive values (p_min, p_max), used if "value_range"
EXPLICIT_LIST = [3,5,] # used if "explicit"
SAMPLE_EVERY = 5 # keep every k-th selected prime (1 = keep all)
# ----- Geometry/visuals -----
R_base = 10 # base circle radius
theta_samples = 10000 # resolution around the circle (lower -> faster)
amplitude0 = 2 # overall ripple amplitude scale
amp_exponent = 0.0 # amplitude ~ amplitude0 * p**amp_exponent (0=equal, >0 emphasize larger primes)
phase_jitter = 0.0 # random phase per ring (radians); 0 disables
lw_ring = .1 # line width for each ring
alpha_ring = .05 # line alpha
radial_growth_per_prime =1 # outward push per ring (try 0.5..3 for clarity)
z_step = 0.0 # vertical separation per ring (0 = flat “puddle”)
#fancy color shit
#cmap = cm.get_cmap("BrGr")
# solid red colormap
cmap = mcolors.ListedColormap(["Blue"])
RNG = np.random.default_rng(0) # deterministic visuals
# ──────────────── prime utils ────────────────
def sieve_up_to(limit: int) -> np.ndarray:
"""Return all primes <= limit (simple vectorized sieve)."""
if limit < 2:
return np.array([], dtype=int)
sieve = np.ones(limit + 1, dtype=bool)
sieve[:2] = False
for p in range(2, int(limit**0.5) + 1):
if sieve[p]:
sieve[p*p::p] = False
return np.flatnonzero(sieve)
def first_n_primes(n: int) -> np.ndarray:
"""Return the first n primes (uses a loose upper bound for nth prime)."""
if n <= 0:
return np.array([], dtype=int)
if n < 6:
limit = 15
else:
nn = float(n)
# Rosser–Schoenfeld-ish bound + safety
limit = int(nn * (np.log(nn) + np.log(np.log(nn))) + 20)
ps = sieve_up_to(limit)
# If our bound was too low (rare), increase and try again.
while ps.size < n:
limit *= 2
ps = sieve_up_to(limit)
return ps[:n]
def primes_by_index_range(k_start: int, k_end: int) -> np.ndarray:
"""Return primes with ordinals k_start..k_end (1-indexed, inclusive)."""
if k_end < k_start:
return np.array([], dtype=int)
ps = first_n_primes(k_end)
return ps[k_start-1:k_end]
def primes_by_value_range(p_min: int, p_max: int) -> np.ndarray:
"""Return all primes in [p_min, p_max]."""
if p_max < 2 or p_max < p_min:
return np.array([], dtype=int)
ps = sieve_up_to(p_max)
return ps[(ps >= p_min) & (ps <= p_max)]
# ─────────────── choose primes ───────────────
if PRIMES_MODE == "first_n":
primes = first_n_primes(FIRST_N)
elif PRIMES_MODE == "index_range":
k0, k1 = INDEX_RANGE
primes = primes_by_index_range(k0, k1)
elif PRIMES_MODE == "value_range":
p0, p1 = VALUE_RANGE
primes = primes_by_value_range(p0, p1)
elif PRIMES_MODE == "explicit":
primes = np.array(sorted(set(EXPLICIT_LIST)), dtype=int)
else:
raise ValueError("PRIMES_MODE must be one of: first_n | index_range | value_range | explicit")
# optional thinning
if SAMPLE_EVERY > 1:
primes = primes[::SAMPLE_EVERY]
num_primes = primes.size
if num_primes == 0:
raise RuntimeError("No primes selected with the current configuration.")
# ─────────────── build rings ───────────────
theta = np.linspace(0, 2*np.pi, theta_samples, endpoint=True)
fig = plt.figure(figsize=(11, 8))
ax = fig.add_subplot(111, projection="3d")
# descriptive title
if PRIMES_MODE == "first_n":
subtitle = f"first_n={FIRST_N}"
elif PRIMES_MODE == "index_range":
subtitle = f"k∈[{INDEX_RANGE[0]},{INDEX_RANGE[1]}]"
elif PRIMES_MODE == "value_range":
subtitle = f"p∈[{VALUE_RANGE[0]},{VALUE_RANGE[1]}]"
else:
subtitle = f"explicit({num_primes})"
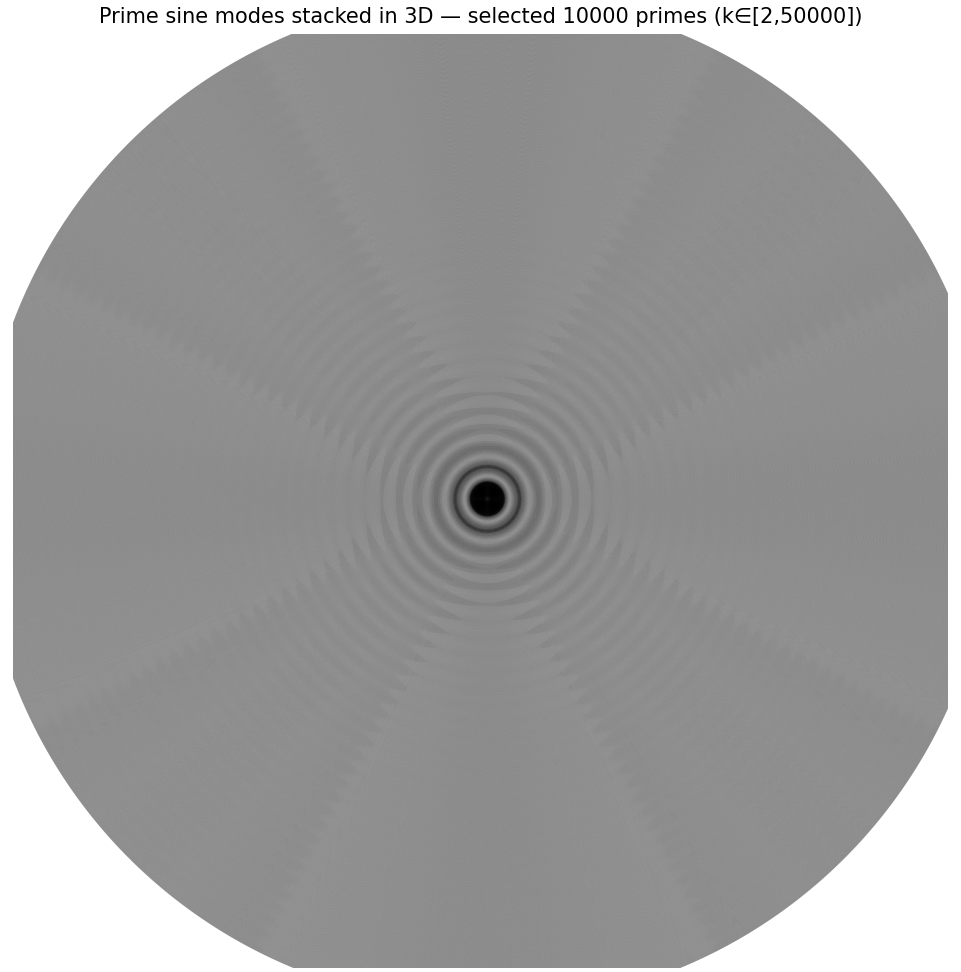
ax.set_title(f"Prime sine modes stacked in 3D — selected {num_primes} primes ({subtitle})")
ax.set_axis_off()
# faint base circle
x0 = R_base*np.cos(theta); y0 = R_base*np.sin(theta)
ax.plot(x0, y0, np.zeros_like(theta), color="0.85", lw=0.8, alpha=0.5)
segs, rgba, lws = [], [], []
for i, p in enumerate(primes):
a = amplitude0 * (p**amp_exponent)
R_i = R_base + radial_growth_per_prime * i
phi = 0.0 if phase_jitter == 0 else RNG.uniform(-phase_jitter, phase_jitter)
r = R_i + a * np.sin(p*theta + phi)
x = r * np.cos(theta)
y = r * np.sin(theta)
z = np.full_like(theta, i * z_step)
segs.append(np.stack([x, y, z], axis=1))
c = cmap(i / max(1, num_primes - 1))
rgba.append((c[0], c[1], c[2], alpha_ring))
lws.append(lw_ring)
coll = Line3DCollection(segs, colors=rgba, linewidths=lws)
ax.add_collection(coll)
# autoscale cube
rmax = (R_base
+ radial_growth_per_prime*(num_primes-1)
+ amplitude0 * (primes.max()**amp_exponent)
+ 0.1)
extent = rmax * 1.15
ax.set_xlim(-extent, extent)
ax.set_ylim(-extent, extent)
ax.set_zlim(-z_step*0.5, z_step*(num_primes-1) + z_step)
ax.view_init(elev=90, azim=0)
plt.tight_layout()
plt.show()
2D wave field v2 – nodes
# prime_wavefield_demo.py (excerpt)
import numpy as np

def gaps_to_freqs(primes):
    gaps = np.diff(primes)
    return 1.0 / gaps

def prime_wave_field(primes, phases=None):
    freqs = gaps_to_freqs(primes)
    if phases is None:
        phases = np.zeros_like(freqs)
    # toy superposition (1D)
    x = np.linspace(0, 1, 2000)
    field = sum(np.cos(2*np.pi*f*x + p) for f, p in zip(freqs, phases))
    return x, field

# ... (put your full script here)
# 3-D “stacked rings” of prime modes with flexible PRIME SELECTION.


import numpy as np
import matplotlib.pyplot as plt
from matplotlib import cm
from mpl_toolkits.mplot3d.art3d import Line3DCollection
import matplotlib.colors as mcolors
import matplotlib.cm as cm

# ───────────────── CONFIG ─────────────────

# ----- How to choose which primes to plot -----
PRIMES_MODE = "index_range"   # one of: "first_n" | "index_range" | "value_range" | "explicit"

FIRST_N        = 1             # used if PRIMES_MODE == "first_n"
INDEX_RANGE    = (1,5000)   # inclusive ordinals (1-indexed): (start_k, end_k), used if "index_range"
VALUE_RANGE    = (2,3)   # inclusive values (p_min, p_max), used if "value_range"
EXPLICIT_LIST  = [3,5,]    # used if "explicit"

SAMPLE_EVERY   = 1        # keep every k-th selected prime (1 = keep all)

# ----- Geometry/visuals -----
R_base = 12                 # base circle radius
theta_samples = 20000         # resolution around the circle (lower -> faster)
amplitude0 = 3              # overall ripple amplitude scale
amp_exponent = 0.0            # amplitude ~ amplitude0 * p**amp_exponent (0=equal, >0 emphasize larger primes)
phase_jitter = 0.0            # random phase per ring (radians); 0 disables

lw_ring = .1                   # line width for each ring
alpha_ring = .4               # line alpha
radial_growth_per_prime = 4     # outward push per ring (try 0.5..3 for clarity)
z_step = 0.0                    # vertical separation per ring (0 = flat “puddle”), starts 3d

#fancy color shit
#cmap = cm.get_cmap("BrGr")


# solid red colormap
cmap = mcolors.ListedColormap(["Red"])


RNG  = np.random.default_rng(0)  # deterministic visuals

# ──────────────── prime utils ────────────────

def sieve_up_to(limit: int) -> np.ndarray:
    """Return all primes <= limit (simple vectorized sieve)."""
    if limit < 2:
        return np.array([], dtype=int)
    sieve = np.ones(limit + 1, dtype=bool)
    sieve[:2] = False
    for p in range(2, int(limit**0.5) + 1):
        if sieve[p]:
            sieve[p*p::p] = False
    return np.flatnonzero(sieve)

def first_n_primes(n: int) -> np.ndarray:
    """Return the first n primes (uses a loose upper bound for nth prime)."""
    if n <= 0:
        return np.array([], dtype=int)
    if n < 6:
        limit = 15
    else:
        nn = float(n)
        # Rosser–Schoenfeld-ish bound + safety
        limit = int(nn * (np.log(nn) + np.log(np.log(nn))) + 20)
    ps = sieve_up_to(limit)
    # If our bound was too low (rare), increase and try again.
    while ps.size < n:
        limit *= 2
        ps = sieve_up_to(limit)
    return ps[:n]

def primes_by_index_range(k_start: int, k_end: int) -> np.ndarray:
    """Return primes with ordinals k_start..k_end (1-indexed, inclusive)."""
    if k_end < k_start:
        return np.array([], dtype=int)
    ps = first_n_primes(k_end)
    return ps[k_start-1:k_end]

def primes_by_value_range(p_min: int, p_max: int) -> np.ndarray:
    """Return all primes in [p_min, p_max]."""
    if p_max < 2 or p_max < p_min:
        return np.array([], dtype=int)
    ps = sieve_up_to(p_max)
    return ps[(ps >= p_min) & (ps <= p_max)]

# ─────────────── choose primes ───────────────

if PRIMES_MODE == "first_n":
    primes = first_n_primes(FIRST_N)

elif PRIMES_MODE == "index_range":
    k0, k1 = INDEX_RANGE
    primes = primes_by_index_range(k0, k1)

elif PRIMES_MODE == "value_range":
    p0, p1 = VALUE_RANGE
    primes = primes_by_value_range(p0, p1)

elif PRIMES_MODE == "explicit":
    primes = np.array(sorted(set(EXPLICIT_LIST)), dtype=int)

else:
    raise ValueError("PRIMES_MODE must be one of: first_n | index_range | value_range | explicit")

# optional thinning
if SAMPLE_EVERY > 1:
    primes = primes[::SAMPLE_EVERY]

num_primes = primes.size
if num_primes == 0:
    raise RuntimeError("No primes selected with the current configuration.")

# ─────────────── build rings ───────────────

theta = np.linspace(0, 2*np.pi, theta_samples, endpoint=True)

fig = plt.figure(figsize=(11, 8))
ax  = fig.add_subplot(111, projection="3d")
# descriptive title
if PRIMES_MODE == "first_n":
    subtitle = f"first_n={FIRST_N}"
elif PRIMES_MODE == "index_range":
    subtitle = f"k∈[{INDEX_RANGE[0]},{INDEX_RANGE[1]}]"
elif PRIMES_MODE == "value_range":
    subtitle = f"p∈[{VALUE_RANGE[0]},{VALUE_RANGE[1]}]"
else:
    subtitle = f"explicit({num_primes})"

ax.set_title(f"Prime sine modes stacked in 3D — selected {num_primes} primes ({subtitle})")
ax.set_axis_off()

# faint base circle
x0 = R_base*np.cos(theta); y0 = R_base*np.sin(theta)
ax.plot(x0, y0, np.zeros_like(theta), color="0.85", lw=0.8, alpha=0.5)

segs, rgba, lws = [], [], []

for i, p in enumerate(primes):
    a   = amplitude0 * (p**amp_exponent)
    R_i = R_base + radial_growth_per_prime * i
    phi = 0.0 if phase_jitter == 0 else RNG.uniform(-phase_jitter, phase_jitter)

    r = R_i + a * np.sin(p*theta + phi)
    x = r * np.cos(theta)
    y = r * np.sin(theta)
    z = np.full_like(theta, i * z_step)

    segs.append(np.stack([x, y, z], axis=1))
    c = cmap(i / max(1, num_primes - 1))
    rgba.append((c[0], c[1], c[2], alpha_ring))
    lws.append(lw_ring)

coll = Line3DCollection(segs, colors=rgba, linewidths=lws)
ax.add_collection(coll)

# autoscale cube
rmax   = (R_base
          + radial_growth_per_prime*(num_primes-1)
          + amplitude0 * (primes.max()**amp_exponent)
          + 0.1)
extent = rmax * 1.15
ax.set_xlim(-extent, extent)
ax.set_ylim(-extent, extent)
ax.set_zlim(-z_step*0.5, z_step*(num_primes-1) + z_step)
ax.view_init(elev=90, azim=0)


plt.tight_layout()
plt.show()
2D wave field – v3
# prime_wavefield_demo.py (excerpt)
import numpy as np

def gaps_to_freqs(primes):
    gaps = np.diff(primes)
    return 1.0 / gaps

def prime_wave_field(primes, phases=None):
    freqs = gaps_to_freqs(primes)
    if phases is None:
        phases = np.zeros_like(freqs)
    # toy superposition (1D)
    x = np.linspace(0, 1, 2000)
    field = sum(np.cos(2*np.pi*f*x + p) for f, p in zip(freqs, phases))
    return x, field

# ... (put your full script here)
# 3-D “stacked rings” of prime modes with flexible PRIME SELECTION.


import numpy as np
import matplotlib.pyplot as plt
from matplotlib import cm
from mpl_toolkits.mplot3d.art3d import Line3DCollection
import matplotlib.colors as mcolors
import matplotlib.cm as cm

# ───────────────── CONFIG ─────────────────

# ----- How to choose which primes to plot -----
PRIMES_MODE = "index_range"   # one of: "first_n" | "index_range" | "value_range" | "explicit"

FIRST_N        = 1             # used if PRIMES_MODE == "first_n"
INDEX_RANGE    = (2,50000)   # inclusive ordinals (1-indexed): (start_k, end_k), used if "index_range"
VALUE_RANGE    = (2, 3)   # inclusive values (p_min, p_max), used if "value_range"
EXPLICIT_LIST  = [3,5,]    # used if "explicit"

SAMPLE_EVERY   = 5         # keep every k-th selected prime (1 = keep all)

# ----- Geometry/visuals -----
R_base = 10                 # base circle radius
theta_samples = 20000         # resolution around the circle (lower -> faster)
amplitude0 = 2.5              # overall ripple amplitude scale
amp_exponent = 0.0            # amplitude ~ amplitude0 * p**amp_exponent (0=equal, >0 emphasize larger primes)
phase_jitter = 0.0            # random phase per ring (radians); 0 disables

lw_ring = .1                   # line width for each ring
alpha_ring = .15               # line alpha
radial_growth_per_prime =10     # outward push per ring (try 0.5..3 for clarity)
z_step = 0.0                    # vertical separation per ring (0 = flat “puddle”)

#fancy color shit
#cmap = cm.get_cmap("BrGr")


# solid red colormap
cmap = mcolors.ListedColormap(["Black"])


RNG  = np.random.default_rng(0)  # deterministic visuals

# ──────────────── prime utils ────────────────

def sieve_up_to(limit: int) -> np.ndarray:
    """Return all primes <= limit (simple vectorized sieve)."""
    if limit < 2:
        return np.array([], dtype=int)
    sieve = np.ones(limit + 1, dtype=bool)
    sieve[:2] = False
    for p in range(2, int(limit**0.5) + 1):
        if sieve[p]:
            sieve[p*p::p] = False
    return np.flatnonzero(sieve)

def first_n_primes(n: int) -> np.ndarray:
    """Return the first n primes (uses a loose upper bound for nth prime)."""
    if n <= 0:
        return np.array([], dtype=int)
    if n < 6:
        limit = 15
    else:
        nn = float(n)
        # Rosser–Schoenfeld-ish bound + safety
        limit = int(nn * (np.log(nn) + np.log(np.log(nn))) + 20)
    ps = sieve_up_to(limit)
    # If our bound was too low (rare), increase and try again.
    while ps.size < n:
        limit *= 2
        ps = sieve_up_to(limit)
    return ps[:n]

def primes_by_index_range(k_start: int, k_end: int) -> np.ndarray:
    """Return primes with ordinals k_start..k_end (1-indexed, inclusive)."""
    if k_end < k_start:
        return np.array([], dtype=int)
    ps = first_n_primes(k_end)
    return ps[k_start-1:k_end]

def primes_by_value_range(p_min: int, p_max: int) -> np.ndarray:
    """Return all primes in [p_min, p_max]."""
    if p_max < 2 or p_max < p_min:
        return np.array([], dtype=int)
    ps = sieve_up_to(p_max)
    return ps[(ps >= p_min) & (ps <= p_max)]

# ─────────────── choose primes ───────────────

if PRIMES_MODE == "first_n":
    primes = first_n_primes(FIRST_N)

elif PRIMES_MODE == "index_range":
    k0, k1 = INDEX_RANGE
    primes = primes_by_index_range(k0, k1)

elif PRIMES_MODE == "value_range":
    p0, p1 = VALUE_RANGE
    primes = primes_by_value_range(p0, p1)

elif PRIMES_MODE == "explicit":
    primes = np.array(sorted(set(EXPLICIT_LIST)), dtype=int)

else:
    raise ValueError("PRIMES_MODE must be one of: first_n | index_range | value_range | explicit")

# optional thinning
if SAMPLE_EVERY > 1:
    primes = primes[::SAMPLE_EVERY]

num_primes = primes.size
if num_primes == 0:
    raise RuntimeError("No primes selected with the current configuration.")

# ─────────────── build rings ───────────────

theta = np.linspace(0, 2*np.pi, theta_samples, endpoint=True)

fig = plt.figure(figsize=(11, 8))
ax  = fig.add_subplot(111, projection="3d")
# descriptive title
if PRIMES_MODE == "first_n":
    subtitle = f"first_n={FIRST_N}"
elif PRIMES_MODE == "index_range":
    subtitle = f"k∈[{INDEX_RANGE[0]},{INDEX_RANGE[1]}]"
elif PRIMES_MODE == "value_range":
    subtitle = f"p∈[{VALUE_RANGE[0]},{VALUE_RANGE[1]}]"
else:
    subtitle = f"explicit({num_primes})"

ax.set_title(f"Prime sine modes stacked in 3D — selected {num_primes} primes ({subtitle})")
ax.set_axis_off()

# faint base circle
x0 = R_base*np.cos(theta); y0 = R_base*np.sin(theta)
ax.plot(x0, y0, np.zeros_like(theta), color="0.85", lw=0.8, alpha=0.5)

segs, rgba, lws = [], [], []

for i, p in enumerate(primes):
    a   = amplitude0 * (p**amp_exponent)
    R_i = R_base + radial_growth_per_prime * i
    phi = 0.0 if phase_jitter == 0 else RNG.uniform(-phase_jitter, phase_jitter)

    r = R_i + a * np.sin(p*theta + phi)
    x = r * np.cos(theta)
    y = r * np.sin(theta)
    z = np.full_like(theta, i * z_step)

    segs.append(np.stack([x, y, z], axis=1))
    c = cmap(i / max(1, num_primes - 1))
    rgba.append((c[0], c[1], c[2], alpha_ring))
    lws.append(lw_ring)

coll = Line3DCollection(segs, colors=rgba, linewidths=lws)
ax.add_collection(coll)

# autoscale cube
rmax   = (R_base
          + radial_growth_per_prime*(num_primes-1)
          + amplitude0 * (primes.max()**amp_exponent)
          + 0.1)
extent = rmax * 1.15
ax.set_xlim(-extent, extent)
ax.set_ylim(-extent, extent)
ax.set_zlim(-z_step*0.5, z_step*(num_primes-1) + z_step)
ax.view_init(elev=90, azim=0)


plt.tight_layout()
plt.show()

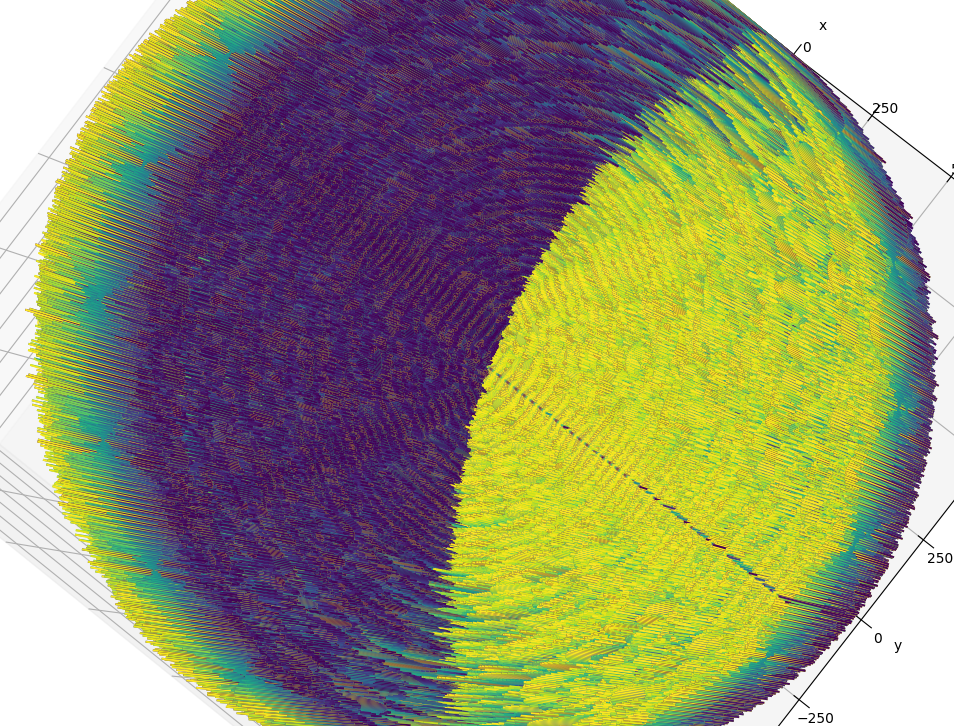
These next python script shows the interference density as amplitudes, displaying true 3d patterns. View angle displays dynamic patterns. These can be tricky; play with ALPHA and z_scale variables.
3D wave field – density as amplitudes
# prime_wavefield_demo.py (excerpt)
import numpy as np

def gaps_to_freqs(primes):
    gaps = np.diff(primes)
    return 1.0 / gaps

def prime_wave_field(primes, phases=None):
    freqs = gaps_to_freqs(primes)
    if phases is None:
        phases = np.zeros_like(freqs)
    # toy superposition (1D)
    x = np.linspace(0, 1, 2000)
    field = sum(np.cos(2*np.pi*f*x + p) for f, p in zip(freqs, phases))
    return x, field

# ... (put your full script here)
# prime_sine_forest_3d_range.py
# 3-D “stacked rings” of prime modes with flexible PRIME SELECTION.

import numpy as np
import matplotlib.pyplot as plt
from matplotlib import cm
from mpl_toolkits.mplot3d.art3d import Line3DCollection
import matplotlib.colors as mcolors
import matplotlib.cm as cm

# ───────────────── CONFIG ─────────────────

# ----- How to choose which primes to plot -----
PRIMES_MODE = "index_range"   # one of: "first_n" | "index_range" | "value_range" | "explicit"

FIRST_N        = 1             # used if PRIMES_MODE == "first_n"
INDEX_RANGE    = (2,600)   # inclusive ordinals (1-indexed): (start_k, end_k), used if "index_range"
VALUE_RANGE    = (2, 12) # inclusive values (p_min, p_max), used if "value_range"
EXPLICIT_LIST  = [3,5,]  # used if "explicit"

SAMPLE_EVERY   = 2          # keep every k-th selected prime (1 = keep all)

# ----- Geometry/visuals -----
R_base = 11                  # base circle radius
theta_samples = 20000         # resolution around the circle (lower -> faster)
amplitude0 = 2.5              # overall ripple amplitude scale
amp_exponent = 0.0            # amplitude ~ amplitude0 * p**amp_exponent (0=equal, >0 emphasize larger primes)
phase_jitter = 0.0            # random phase per ring (radians); 0 disables

lw_ring = .2                   # line width for each ring
alpha_ring = .9               # line alpha
radial_growth_per_prime =5     # outward push per ring (try 0.5..3 for clarity)
z_step = 0.0                    # vertical separation per ring (0 = flat “puddle”)

#fancy color shit
#cmap = cm.get_cmap("BrGr")


# solid red colormap
cmap = mcolors.ListedColormap(["Black"])


RNG  = np.random.default_rng(0)  # deterministic visuals

# ──────────────── prime utils ────────────────

def sieve_up_to(limit: int) -> np.ndarray:
    """Return all primes <= limit (simple vectorized sieve)."""
    if limit < 2:
        return np.array([], dtype=int)
    sieve = np.ones(limit + 1, dtype=bool)
    sieve[:2] = False
    for p in range(2, int(limit**0.5) + 1):
        if sieve[p]:
            sieve[p*p::p] = False
    return np.flatnonzero(sieve)

def first_n_primes(n: int) -> np.ndarray:
    """Return the first n primes (uses a loose upper bound for nth prime)."""
    if n <= 0:
        return np.array([], dtype=int)
    if n < 6:
        limit = 15
    else:
        nn = float(n)
        # Rosser–Schoenfeld-ish bound + safety
        limit = int(nn * (np.log(nn) + np.log(np.log(nn))) + 20)
    ps = sieve_up_to(limit)
    # If our bound was too low (rare), increase and try again.
    while ps.size < n:
        limit *= 2
        ps = sieve_up_to(limit)
    return ps[:n]

def primes_by_index_range(k_start: int, k_end: int) -> np.ndarray:
    """Return primes with ordinals k_start..k_end (1-indexed, inclusive)."""
    if k_end < k_start:
        return np.array([], dtype=int)
    ps = first_n_primes(k_end)
    return ps[k_start-1:k_end]

def primes_by_value_range(p_min: int, p_max: int) -> np.ndarray:
    """Return all primes in [p_min, p_max]."""
    if p_max < 2 or p_max < p_min:
        return np.array([], dtype=int)
    ps = sieve_up_to(p_max)
    return ps[(ps >= p_min) & (ps <= p_max)]

# ─────────────── choose primes ───────────────

if PRIMES_MODE == "first_n":
    primes = first_n_primes(FIRST_N)

elif PRIMES_MODE == "index_range":
    k0, k1 = INDEX_RANGE
    primes = primes_by_index_range(k0, k1)

elif PRIMES_MODE == "value_range":
    p0, p1 = VALUE_RANGE
    primes = primes_by_value_range(p0, p1)

elif PRIMES_MODE == "explicit":
    primes = np.array(sorted(set(EXPLICIT_LIST)), dtype=int)

else:
    raise ValueError("PRIMES_MODE must be one of: first_n | index_range | value_range | explicit")

# optional thinning
if SAMPLE_EVERY > 1:
    primes = primes[::SAMPLE_EVERY]

num_primes = primes.size
if num_primes == 0:
    raise RuntimeError("No primes selected with the current configuration.")

# ─────────────── build rings ───────────────

theta = np.linspace(0, 2*np.pi, theta_samples, endpoint=True)

fig = plt.figure(figsize=(11, 8))
ax  = fig.add_subplot(111, projection="3d")
# descriptive title
if PRIMES_MODE == "first_n":
    subtitle = f"first_n={FIRST_N}"
elif PRIMES_MODE == "index_range":
    subtitle = f"k∈[{INDEX_RANGE[0]},{INDEX_RANGE[1]}]"
elif PRIMES_MODE == "value_range":
    subtitle = f"p∈[{VALUE_RANGE[0]},{VALUE_RANGE[1]}]"
else:
    subtitle = f"explicit({num_primes})"

ax.set_title(f"Prime sine modes stacked in 3D — selected {num_primes} primes ({subtitle})")
ax.set_axis_off()

# faint base circle
x0 = R_base*np.cos(theta); y0 = R_base*np.sin(theta)
ax.plot(x0, y0, np.zeros_like(theta), color="0.85", lw=0.8, alpha=0.5)

segs, rgba, lws = [], [], []

for i, p in enumerate(primes):
    a   = amplitude0 * (p**amp_exponent)
    R_i = R_base + radial_growth_per_prime * i
    phi = 0.0 if phase_jitter == 0 else RNG.uniform(-phase_jitter, phase_jitter)

    r = R_i + a * np.sin(p*theta + phi)
    x = r * np.cos(theta)
    y = r * np.sin(theta)
    z = np.full_like(theta, i * z_step)

    segs.append(np.stack([x, y, z], axis=1))
    c = cmap(i / max(1, num_primes - 1))
    rgba.append((c[0], c[1], c[2], alpha_ring))
    lws.append(lw_ring)

coll = Line3DCollection(segs, colors=rgba, linewidths=lws)
ax.add_collection(coll)

# autoscale cube
rmax   = (R_base
          + radial_growth_per_prime*(num_primes-1)
          + amplitude0 * (primes.max()**amp_exponent)
          + 0.1)
extent = rmax * 1.15
ax.set_xlim(-extent, extent)
ax.set_ylim(-extent, extent)
ax.set_zlim(-z_step*0.5, z_step*(num_primes-1) + z_step)
ax.view_init(elev=90, azim=0)


plt.tight_layout()
plt.show()
3D density amplitude v2
# prime_wavefield_demo.py (excerpt)
import numpy as np

def gaps_to_freqs(primes):
    gaps = np.diff(primes)
    return 1.0 / gaps

def prime_wave_field(primes, phases=None):
    freqs = gaps_to_freqs(primes)
    if phases is None:
        phases = np.zeros_like(freqs)
    # toy superposition (1D)
    x = np.linspace(0, 1, 2000)
    field = sum(np.cos(2*np.pi*f*x + p) for f, p in zip(freqs, phases))
    return x, field

# ... (put your full script here)
# prime_sine_forest_3d_range.py
# 3-D “stacked rings” of prime modes with flexible PRIME SELECTION.

# adjacent_prime_interference_density.py
# Heatmap (filled disk) of adjacent-prime pair interference on concentric rings

import numpy as np
import matplotlib.pyplot as plt

# ---------------- user controls ----------------
N_PAIRS   = 1000        # how many adjacent-prime pairs (rings)
THETA_SAMPLES = 2048    # angular samples per ring (columns)
R0        = 0           # first ring radius (pixels/units)
DR        = 1           # ring spacing (pixels/units)

ALPHA     = 0.02        # amplitude falloff A_m = m^(-ALPHA)  (very weak)
MODE      = 'sum'       # 'sum' or 'product'
PER_RING_SCALE = True   # normalize each ring by its own max|z|
CMAP      = 'viridis'
TITLE     = 'Adjacent-prime interference rings (line version, gradient)'
ANNOTATE_DIAGONAL = True
# ------------------------------------------------

def first_n_primes(n: int):
    if n <= 0: return []
    size = max(20, int(n * (np.log(max(3,n)) + np.log(max(3,np.log(max(3,n))))) + 10))
    while True:
        sieve = np.ones(size, dtype=bool)
        sieve[:2] = False
        for p in range(2, int(size**0.5)+1):
            if sieve[p]:
                sieve[p*p:size:p] = False
        ps = np.flatnonzero(sieve)
        if len(ps) >= n:
            return ps[:n].tolist()
        size *= 2

def prime_pairs(n_pairs: int):
    ps = first_n_primes(n_pairs + 1)
    return np.array([ps[:-1], ps[1:]]).T  # shape (n_pairs, 2)

def ring_interference(theta, m1, m2, alpha=0.02, mode='sum'):
    A1 = m1**(-alpha)
    A2 = m2**(-alpha)
    u1 = A1*np.cos(m1*theta)
    u2 = A2*np.cos(m2*theta)
    return (u1 + u2) if mode == 'sum' else (u1*u2)

def main():
    pairs = prime_pairs(N_PAIRS)                 # (N,2)
    theta = np.linspace(0, 2*np.pi, THETA_SAMPLES, endpoint=False)  # (T,)

    # compute z for each ring (vectorized over theta)
    Z = np.empty((N_PAIRS, THETA_SAMPLES), dtype=np.float32)
    for i, (m1, m2) in enumerate(pairs):
        z = ring_interference(theta, int(m1), int(m2), alpha=ALPHA, mode=MODE)
        if PER_RING_SCALE:
            s = np.max(np.abs(z))
            if s > 1e-15: z = z / s
        Z[i] = z

    # optional: map z from [-1,1] -> [0,1] for colormap
    Zc = 0.5*(Z + 1.0)

    # build polar grid and render as a filled disk
    r = R0 + np.arange(N_PAIRS)*DR                    # (N,)
    R, T = np.meshgrid(r, theta, indexing='ij')       # (N,T)
    X = R*np.cos(T); Y = R*np.sin(T)

    fig = plt.figure(figsize=(12, 12))
    ax = fig.add_subplot(111)
    ax.set_aspect('equal', 'box')
    ax.set_axis_off()

    # pcolormesh wants bin corners; make simple half-step edges
    re = np.concatenate([r - 0.5*DR, [r[-1] + 0.5*DR]])
    te = np.concatenate([theta, [2*np.pi]])
    Re, Te = np.meshgrid(re, te, indexing='ij')
    Xe = Re*np.cos(Te); Ye = Re*np.sin(Te)

    # draw the heatmap
    pm = ax.pcolormesh(Xe, Ye, Zc, shading='auto', cmap=CMAP)

    # outer circular boundary
    Rmax = r[-1] + 0.5*DR
    circ = plt.Circle((0,0), Rmax, edgecolor='0.5', facecolor='none', lw=2)
    ax.add_patch(circ)

    # diagonal seam (just a guide for the eye)
    if ANNOTATE_DIAGONAL:
        ax.plot([-Rmax, Rmax], [Rmax, -Rmax], ls='--', lw=1.5, color='0.6', alpha=0.8)

    # colorbar
    cb = fig.colorbar(pm, ax=ax, shrink=0.85, pad=0.02)
    cb.set_label('normalized pair interference (z)')

    ax.set_title(f"{TITLE}\nN_pairs={N_PAIRS}, α={ALPHA}, mode={MODE}, "
                 f"DR={DR}, per_ring_scale={PER_RING_SCALE}", pad=12)

    plt.tight_layout()
    plt.show()

if __name__ == "__main__":
    main()
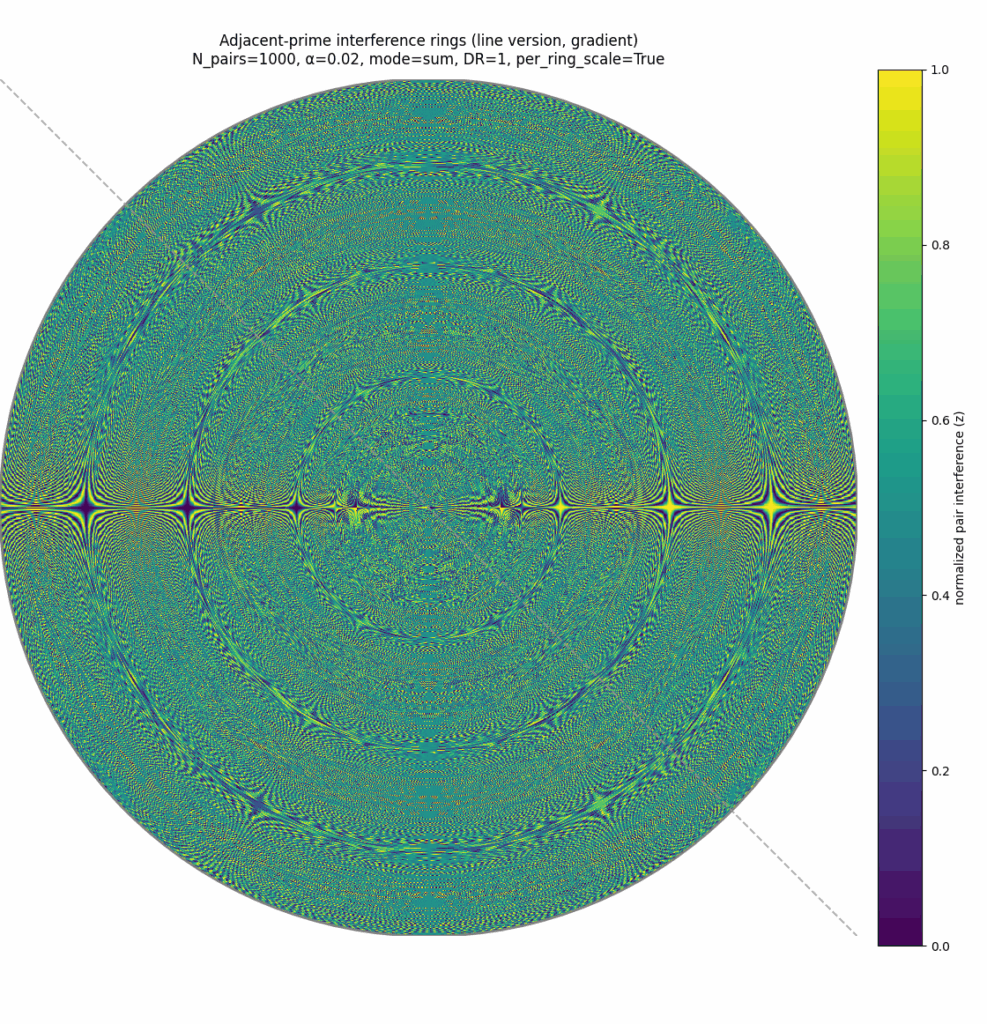
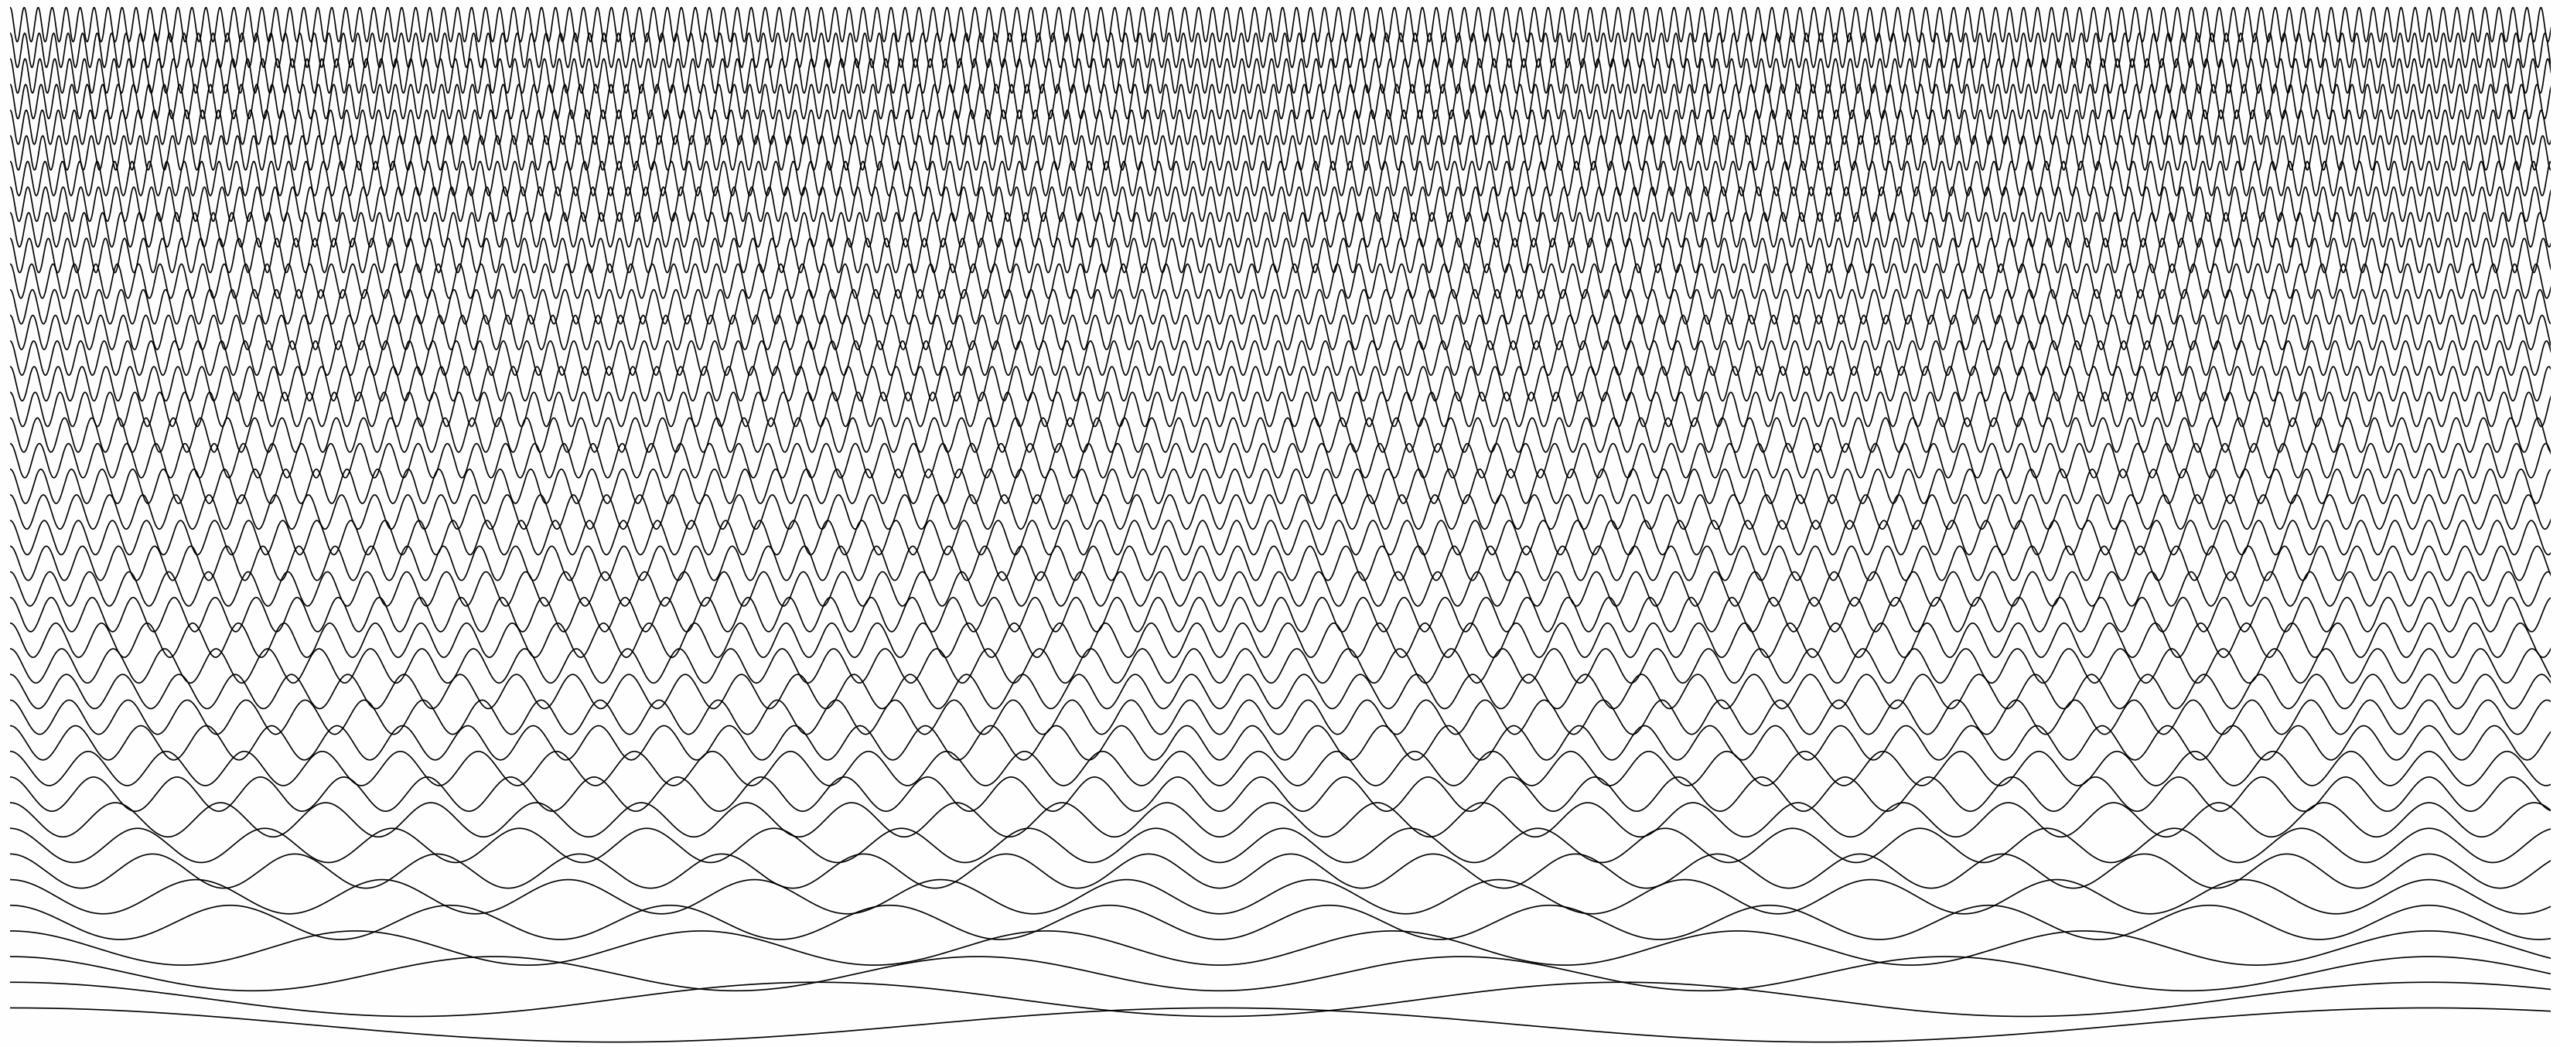
Shown above on the right, this next python script shows the prime waves stacked in a linear boundary.
2D wave field – linear boundaries
# prime_wavefield_demo.py (excerpt)
import numpy as np

def gaps_to_freqs(primes):
    gaps = np.diff(primes)
    return 1.0 / gaps

def prime_wave_field(primes, phases=None):
    freqs = gaps_to_freqs(primes)
    if phases is None:
        phases = np.zeros_like(freqs)
    # toy superposition (1D)
    x = np.linspace(0, 1, 2000)
    field = sum(np.cos(2*np.pi*f*x + p) for f, p in zip(freqs, phases))
    return x, field

# ... (put your full script here)
# prime_sine_forest_3d_range.py
# 3-D “stacked rings” of prime modes with flexible PRIME SELECTION.

#!/usr/bin/env python3
# Stacked 1D prime waves with vertical dotted lines at every crest (tip).
# Lowest primes are at the BOTTOM; higher primes stack upward.

import numpy as np
import math
import matplotlib.pyplot as plt

# ------------ knobs ------------
N_LINES       = 60           # how many primes to show (first N)
R_MAX         = 120.0        # plot r from 0 .. R_MAX (units)
SAMPLES       = 20000         # x resolution

k_base        = 0.055        # rad / unit
k_power       = 1.0          # k(p) = k_base * p**k_power
phase_mode    = "zero"       # "zero" or "random"
phase_jitter  = 0.         # rad, if phase_mode == "random"

amp_scale     =.06         # same amplitude for every line
line_spacing  = .1         # vertical gap between stacked lines
draw_sum      = False        # add the sum as the last (top) line
wave_linewidth = 0.3         # line width for waves


# Crest (tip) markers
DRAW_TIP_LINES = False      # make true to see verticle lines through crest tips for comparison
TIP_LINE_MODE  = "full"      # "full" spans the whole figure; "local" draws a short segment per line
TIP_LOCAL_FRAC = 0.45        # half-height of local segment as a fraction of line_spacing
TIP_COLOR      = (0, 0, 0, 0.35)
TIP_LW         = .1
TIP_STYLE      = "-"         # dotted

# Clean layout toggles
SHOW_LABELS = False          # left-side per-line labels (prime/k/λ)
SHOW_TITLE  = True           # overall title
SAVE_PATH   = None           # e.g., "stacked_prime_lines.png" or None to skip saving

# ------------ primes ------------
def first_n_primes(n: int):
    if n <= 0:
        return []
    if n < 6:
        limit = 15
    else:
        nn = float(n)
        limit = int(nn*(math.log(nn) + math.log(math.log(nn))) + 10*nn)
    sieve = np.ones(limit+1, dtype=bool)
    sieve[:2] = False
    for p in range(2, int(limit**0.5)+1):
        if sieve[p]:
            sieve[p*p::p] = False
    return np.flatnonzero(sieve)[:n].tolist()

primes = first_n_primes(N_LINES)

# ------------ x-axis (radius) ------------
r = np.linspace(0.0, R_MAX, SAMPLES)

# ------------ crest (tip) positions ------------
def crest_positions(k: float, phi: float, r_max: float):
    """Return radii r where cos(k r + phi) = +1 (crests) within [0, r_max]."""
    twopi = 2*np.pi
    # smallest n with r >= 0
    n = int(np.ceil(phi / twopi))
    rs = []
    while True:
        rr = (twopi*n - phi) / k
        if rr > r_max + 1e-12:
            break
        if rr >= 0.0:
            rs.append(rr)
        n += 1
    return np.array(rs, float)

# ------------ build lines ------------
rng = np.random.default_rng(123)
lines, labels, crest_lists = [], [], []

for p in primes:
    k   = k_base * (p**k_power)
    phi = 0.0 if phase_mode == "zero" else rng.uniform(-phase_jitter, phase_jitter)
    z   = amp_scale * np.cos(k*r + phi)
    lines.append(z)
    crest_lists.append(crest_positions(k, phi, R_MAX))

    lam = 2*np.pi/k
    labels.append(f"p={p}  k={k:.3f}  λ={lam:.1f}")

if draw_sum:
    lines.append(np.sum(np.stack(lines, axis=0), axis=0))
    crest_lists.append(np.array([]))   # skip crest markers for the sum
    labels.append("sum of above")

# ------------ plot (stacked; LOW primes at BOTTOM) ------------
nrows  = len(lines)
height = max(6, 1.2*nrows)
fig, ax = plt.subplots(figsize=(10, height))

# clean sketch look
ax.set_xticks([]); ax.set_yticks([])
for spine in ax.spines.values():
    spine.set_visible(False)

# vertical offsets from bottom upward
offsets = np.arange(0, nrows) * line_spacing  # 0, 1s, 2s, ...

for z, off, lab, tips in zip(lines, offsets, labels, crest_lists):
    ax.plot(r, z + off, color="black", linewidth=wave_linewidth)
    if SHOW_LABELS:
        ax.text(r[0], off, lab, va="center", ha="left", fontsize=10)

    if DRAW_TIP_LINES and tips.size:
        if TIP_LINE_MODE == "full":
            for rr in tips:
                ax.axvline(rr, linestyle=TIP_STYLE, color=TIP_COLOR, linewidth=TIP_LW)
        else:
            y0 = off - TIP_LOCAL_FRAC*line_spacing
            y1 = off + TIP_LOCAL_FRAC*line_spacing
            for rr in tips:
                ax.plot([rr, rr], [y0, y1], linestyle=TIP_STYLE, color=TIP_COLOR, linewidth=TIP_LW)

ax.set_xlim(r.min(), r.max())
ax.set_ylim(-line_spacing, offsets.max() + line_spacing)

if SHOW_TITLE:
    ax.set_title("Stacked 1D prime waves — crests marked with vertical dotted lines")

plt.tight_layout()
plt.subplots_adjust(left=0.03)  # tighten left margin (good when labels are hidden)

if SAVE_PATH:
    plt.savefig(SAVE_PATH, dpi=150, bbox_inches="tight")

plt.show()
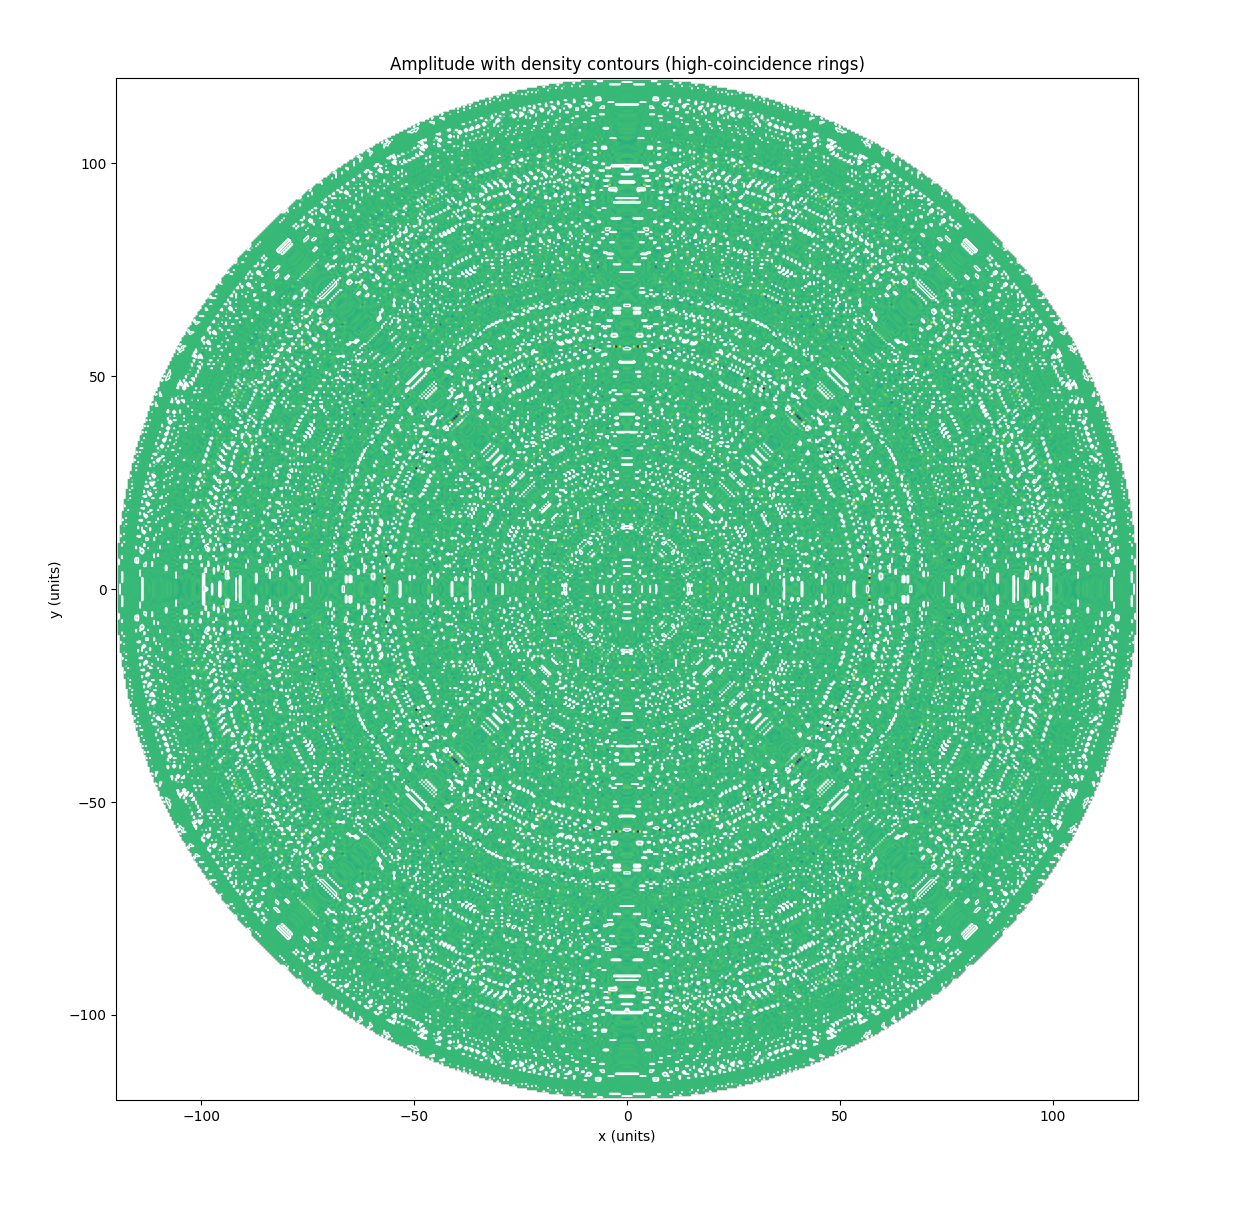
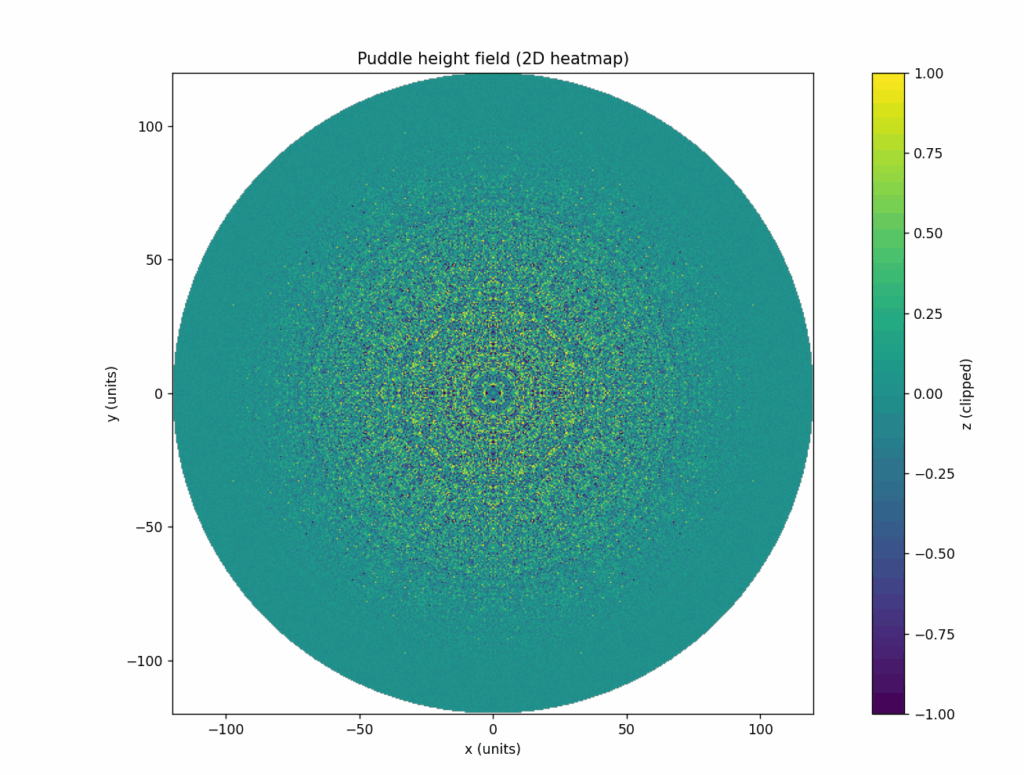
Below, this python script shows the the standing wave propagations with selected prime waves and gives a phase-coincidence density heatmap. It creates the multi-mode standing field, then separately measures where many modes align in phase (a “coincidence density”).
3D wave field – standing waves
# prime_wavefield_demo.py (excerpt)
import numpy as np

def gaps_to_freqs(primes):
    gaps = np.diff(primes)
    return 1.0 / gaps

def prime_wave_field(primes, phases=None):
    freqs = gaps_to_freqs(primes)
    if phases is None:
        phases = np.zeros_like(freqs)
    # toy superposition (1D)
    x = np.linspace(0, 1, 2000)
    field = sum(np.cos(2*np.pi*f*x + p) for f, p in zip(freqs, phases))
    return x, field

# ... (put your full script here)
# prime_sine_forest_3d_range.py
# 3-D “stacked rings” of prime modes with flexible PRIME SELECTION.

#!/usr/bin/env python3
# Stacked 1D prime waves with vertical dotted lines at every crest (tip).
# Lowest primes are at the BOTTOM; higher primes stack upward.

import numpy as np
import math
import matplotlib.pyplot as plt

# ------------ knobs ------------
N_LINES       = 60           # how many primes to show (first N)
R_MAX         = 120.0        # plot r from 0 .. R_MAX (units)
SAMPLES       = 20000         # x resolution

k_base        = 0.055        # rad / unit
k_power       = 1.0          # k(p) = k_base * p**k_power
phase_mode    = "zero"       # "zero" or "random"
phase_jitter  = 0.         # rad, if phase_mode == "random"

amp_scale     =.06         # same amplitude for every line
line_spacing  = .1         # vertical gap between stacked lines
draw_sum      = False        # add the sum as the last (top) line
wave_linewidth = 0.3         # line width for waves


# Crest (tip) markers
DRAW_TIP_LINES = False      # make true to see verticle lines through crest tips for comparison
TIP_LINE_MODE  = "full"      # "full" spans the whole figure; "local" draws a short segment per line
TIP_LOCAL_FRAC = 0.45        # half-height of local segment as a fraction of line_spacing
TIP_COLOR      = (0, 0, 0, 0.35)
TIP_LW         = .1
TIP_STYLE      = "-"         # dotted

# Clean layout toggles
SHOW_LABELS = False          # left-side per-line labels (prime/k/λ)
SHOW_TITLE  = True           # overall title
SAVE_PATH   = None           # e.g., "stacked_prime_lines.png" or None to skip saving

# ------------ primes ------------
def first_n_primes(n: int):
    if n <= 0:
        return []
    if n < 6:
        limit = 15
    else:
        nn = float(n)
        limit = int(nn*(math.log(nn) + math.log(math.log(nn))) + 10*nn)
    sieve = np.ones(limit+1, dtype=bool)
    sieve[:2] = False
    for p in range(2, int(limit**0.5)+1):
        if sieve[p]:
            sieve[p*p::p] = False
    return np.flatnonzero(sieve)[:n].tolist()

primes = first_n_primes(N_LINES)

# ------------ x-axis (radius) ------------
r = np.linspace(0.0, R_MAX, SAMPLES)

# ------------ crest (tip) positions ------------
def crest_positions(k: float, phi: float, r_max: float):
    """Return radii r where cos(k r + phi) = +1 (crests) within [0, r_max]."""
    twopi = 2*np.pi
    # smallest n with r >= 0
    n = int(np.ceil(phi / twopi))
    rs = []
    while True:
        rr = (twopi*n - phi) / k
        if rr > r_max + 1e-12:
            break
        if rr >= 0.0:
            rs.append(rr)
        n += 1
    return np.array(rs, float)

# ------------ build lines ------------
rng = np.random.default_rng(123)
lines, labels, crest_lists = [], [], []

for p in primes:
    k   = k_base * (p**k_power)
    phi = 0.0 if phase_mode == "zero" else rng.uniform(-phase_jitter, phase_jitter)
    z   = amp_scale * np.cos(k*r + phi)
    lines.append(z)
    crest_lists.append(crest_positions(k, phi, R_MAX))

    lam = 2*np.pi/k
    labels.append(f"p={p}  k={k:.3f}  λ={lam:.1f}")

if draw_sum:
    lines.append(np.sum(np.stack(lines, axis=0), axis=0))
    crest_lists.append(np.array([]))   # skip crest markers for the sum
    labels.append("sum of above")

# ------------ plot (stacked; LOW primes at BOTTOM) ------------
nrows  = len(lines)
height = max(6, 1.2*nrows)
fig, ax = plt.subplots(figsize=(10, height))

# clean sketch look
ax.set_xticks([]); ax.set_yticks([])
for spine in ax.spines.values():
    spine.set_visible(False)

# vertical offsets from bottom upward
offsets = np.arange(0, nrows) * line_spacing  # 0, 1s, 2s, ...

for z, off, lab, tips in zip(lines, offsets, labels, crest_lists):
    ax.plot(r, z + off, color="black", linewidth=wave_linewidth)
    if SHOW_LABELS:
        ax.text(r[0], off, lab, va="center", ha="left", fontsize=10)

    if DRAW_TIP_LINES and tips.size:
        if TIP_LINE_MODE == "full":
            for rr in tips:
                ax.axvline(rr, linestyle=TIP_STYLE, color=TIP_COLOR, linewidth=TIP_LW)
        else:
            y0 = off - TIP_LOCAL_FRAC*line_spacing
            y1 = off + TIP_LOCAL_FRAC*line_spacing
            for rr in tips:
                ax.plot([rr, rr], [y0, y1], linestyle=TIP_STYLE, color=TIP_COLOR, linewidth=TIP_LW)

ax.set_xlim(r.min(), r.max())
ax.set_ylim(-line_spacing, offsets.max() + line_spacing)

if SHOW_TITLE:
    ax.set_title("Stacked 1D prime waves — crests marked with vertical dotted lines")

plt.tight_layout()
plt.subplots_adjust(left=0.03)  # tighten left margin (good when labels are hidden)

if SAVE_PATH:
    plt.savefig(SAVE_PATH, dpi=150, bbox_inches="tight")

plt.show()
Here is the formal published paper below. Or it can be seen at https://zenodo.org/records/17269878